IC Markets Home Sign in Web Trader Contact Us
IC Markets Social IC Markets Social

Information Hub for
Serious Traders

  • ABOUT US
  • OPEN LIVE ACCOUNT
  • OPEN DEMO ACCOUNT
  • TRADE NOW
  • VISIT OUR BLOG
IC Markets Social
  • ABOUT US
  • OPEN LIVE ACCOUNT
  • OPEN DEMO ACCOUNT
  • TRADE NOW
  • VISIT OUR BLOG
May 14, 2024North_American_Stocks_esIC Markets

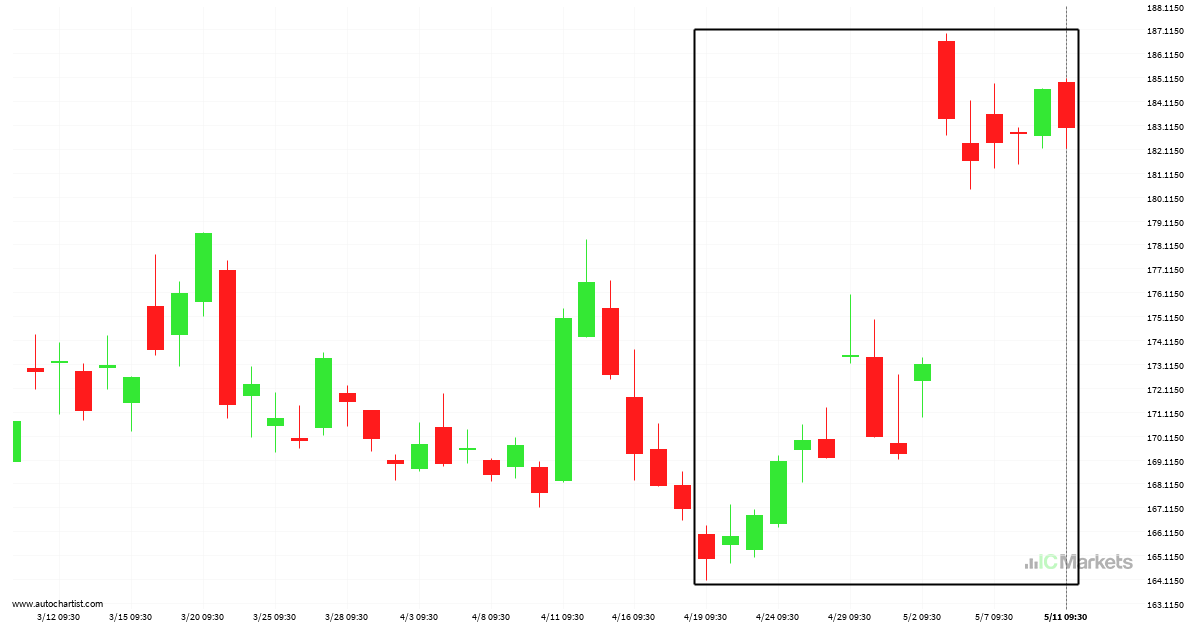
Cambio dramático en Apple Inc.. ¿Una muestra de lo que vendrá?

El Apple Inc. ha experimentado un excepcional movimiento ascendente de un 10,94% de 164.96 a 183.01 en 23 días.

Read more
May 13, 2024North_American_Stocks_esIC Markets

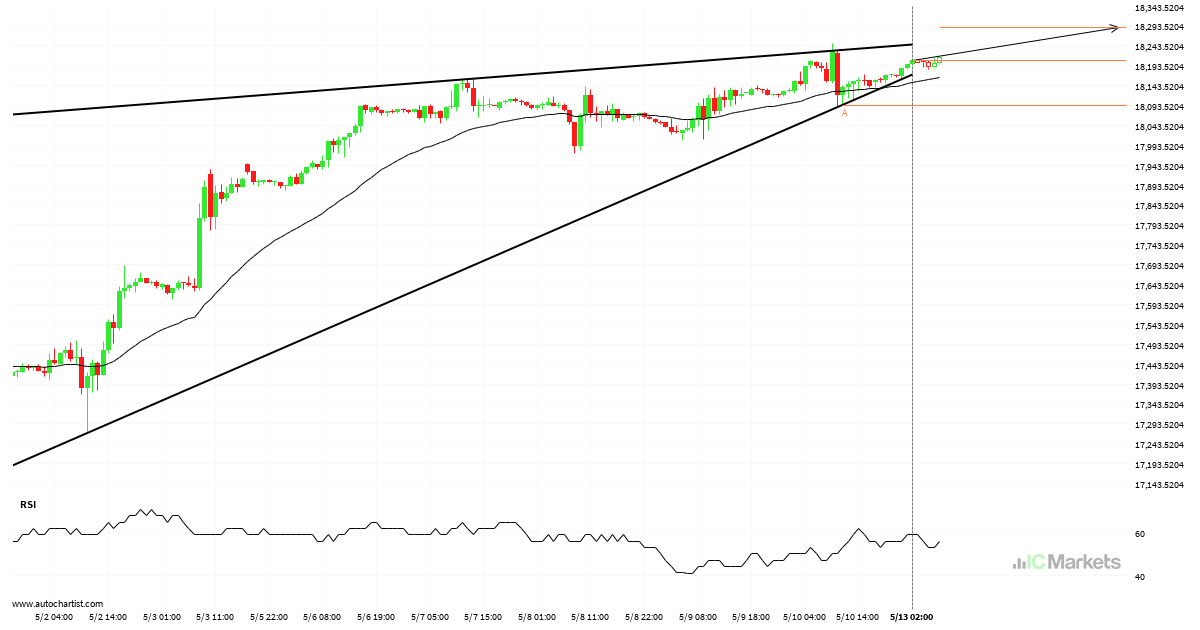
US Tech 100 Index – Reversal Patrón de gráfico – Cuña ascendente

El US Tech 100 Index avanza hacia una línea de resistencia. Como le hemos visto retroceder desde esta línea anteriormente, podríamos presenciar, o bien, una ruptura a través de esta línea o una recuperación a los niveles actuales. Ha llegado a esta línea en numerosas ocasiones en los últimos 14 días y puede probarla de […]

Read more
May 10, 2024North_American_Stocks_esIC Markets

El US Tech 100 Index se aproxima a la resistencia de un Cuña ascendente

El US Tech 100 Index se dirige hacia la línea de resistencia de un Cuña ascendente y puede alcanzar este punto en las próximas 2 días. Ha probado esta línea ya en numerosas ocasiones en el pasado, y esta vez no tendría porqué ser diferente y terminar con una recuperación en lugar de una irrupción. […]

Read more
May 9, 2024North_American_Stocks_esIC Markets

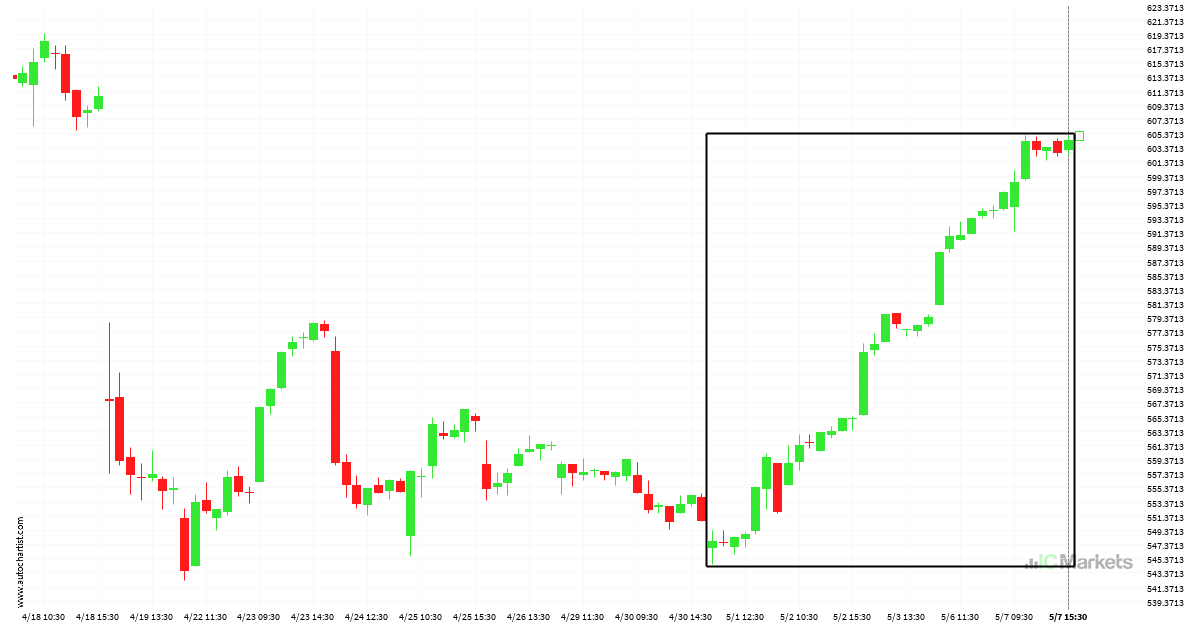
Gran movimiento en Coca-Cola Co., ¿se lo perdió?

Para aquellos de ustedes que no creen en las tendencias, esta puede ser una oportunidad para aprovechar un excepcional movimiento de un 7,87% en Coca-Cola Co.. Este movimiento ha ocurrido durante los últimos 23 días. Por otro lado, para aquellos que siguen las tendencias, deben considerar aprovecharse de esta.

Read more
May 8, 2024North_American_Stocks_esIC Markets

Una racha de 6 días upward en Netflix Inc.

Aquellos de ustedes que sean seguidores de tendencias probablemente estarán observando ansiosamente Netflix Inc. para comprobar si el último movimiento de un 10,33% continúa. Si no lo hace, las personas fieles al método de reversión a la media estarán encantadas con este excepcionalmente gran movimiento de 7 días.

Read more
May 3, 2024North_American_Stocks_esIC Markets

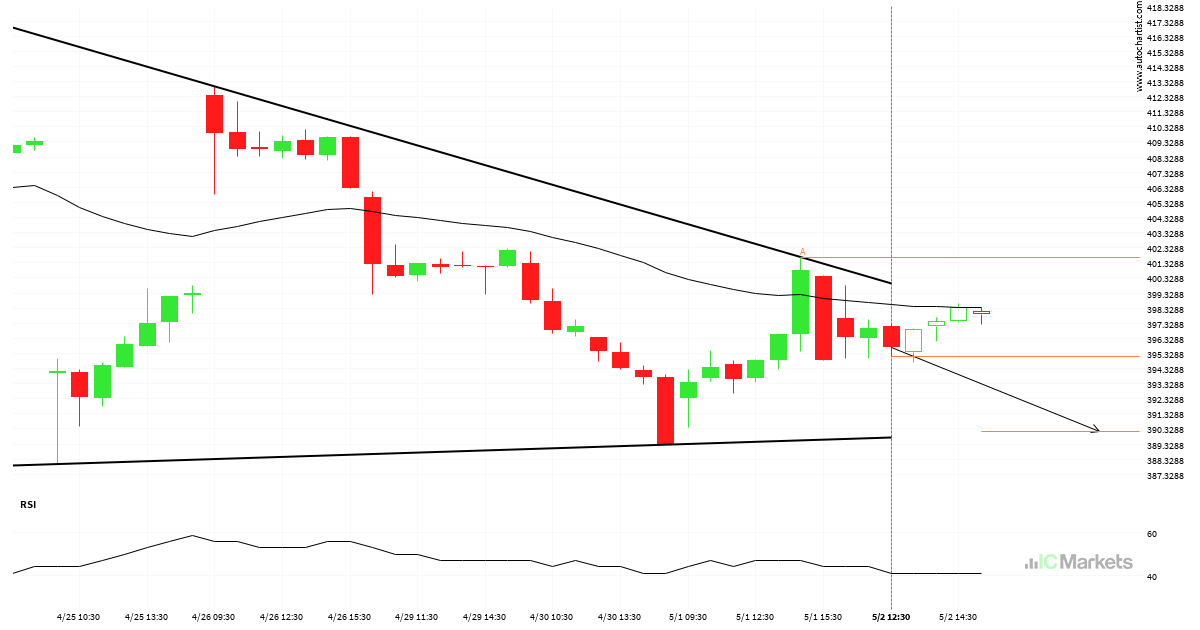
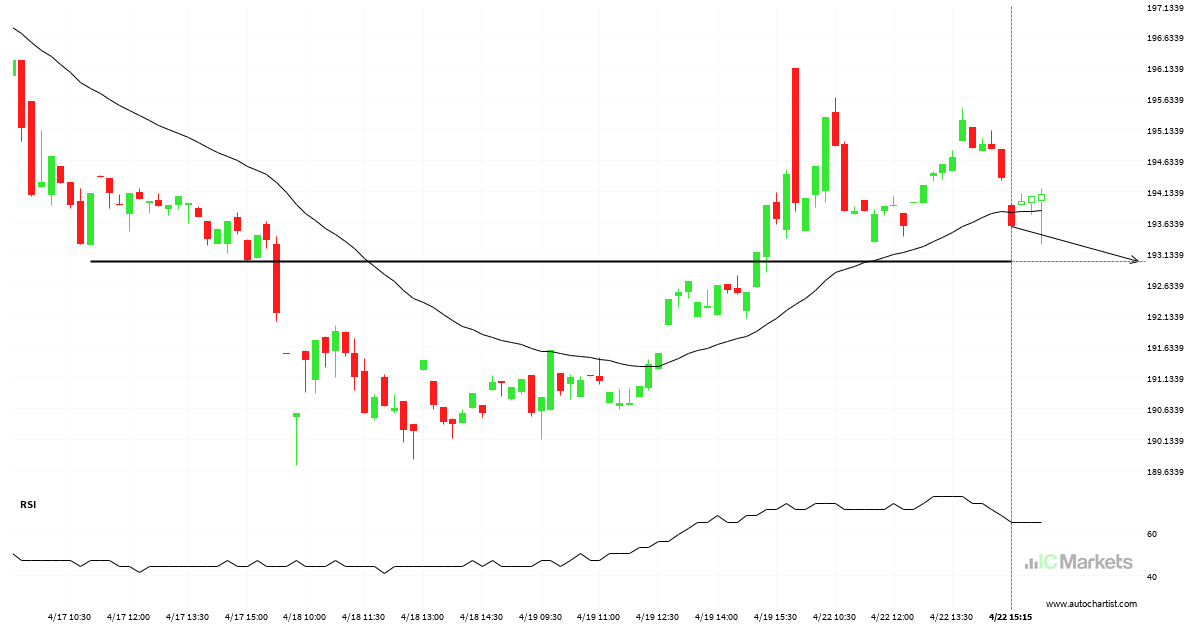
Posible ruptura del nivel de soporte en el Microsoft Corporation

El Microsoft Corporation avanza hacia la línea de soporte de un Triángulo descendiente, que ya ha probado varias veces en el pasado. Hemos visto un retroceso antes desde esta línea, así que en esta etapa no está claro si atravesará esta línea o se recuperará como lo ha hecho anteriormente. Si el Microsoft Corporation continúa […]

Read more
May 1, 2024North_American_Stocks_esIC Markets

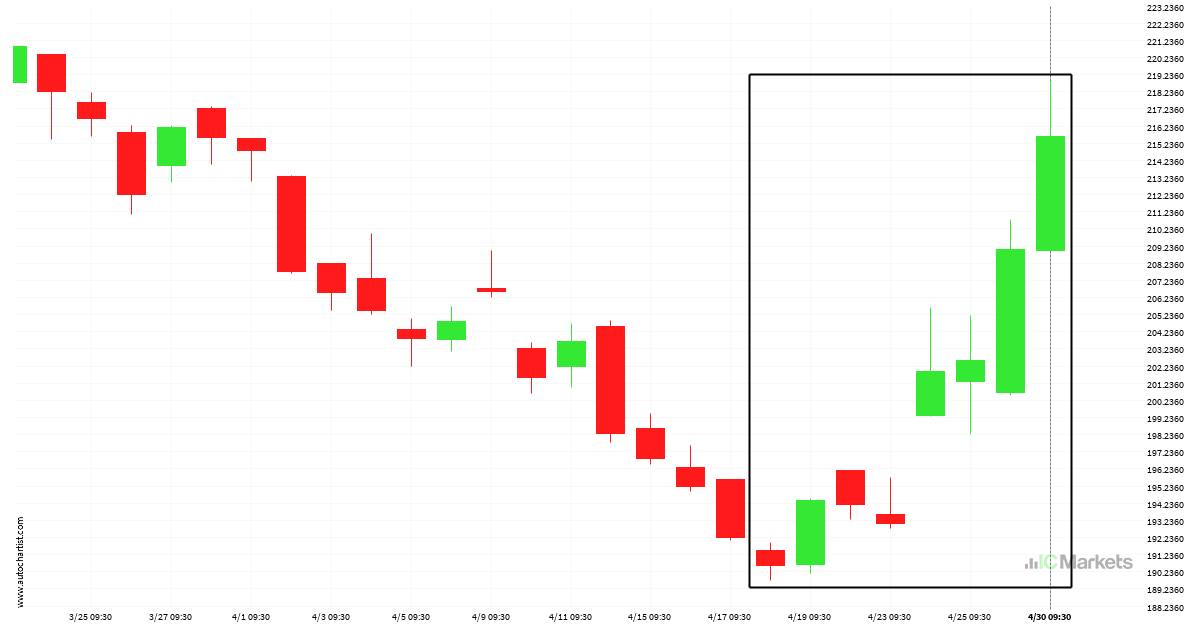
Biogen Idec Inc: movimiento extremo, una oportunidad excepcional

Biogen Idec Inc llegó a 215.62 después de un movimiento del 13,16% que ha durado 13 días.

Read more
April 30, 2024North_American_Stocks_esIC Markets

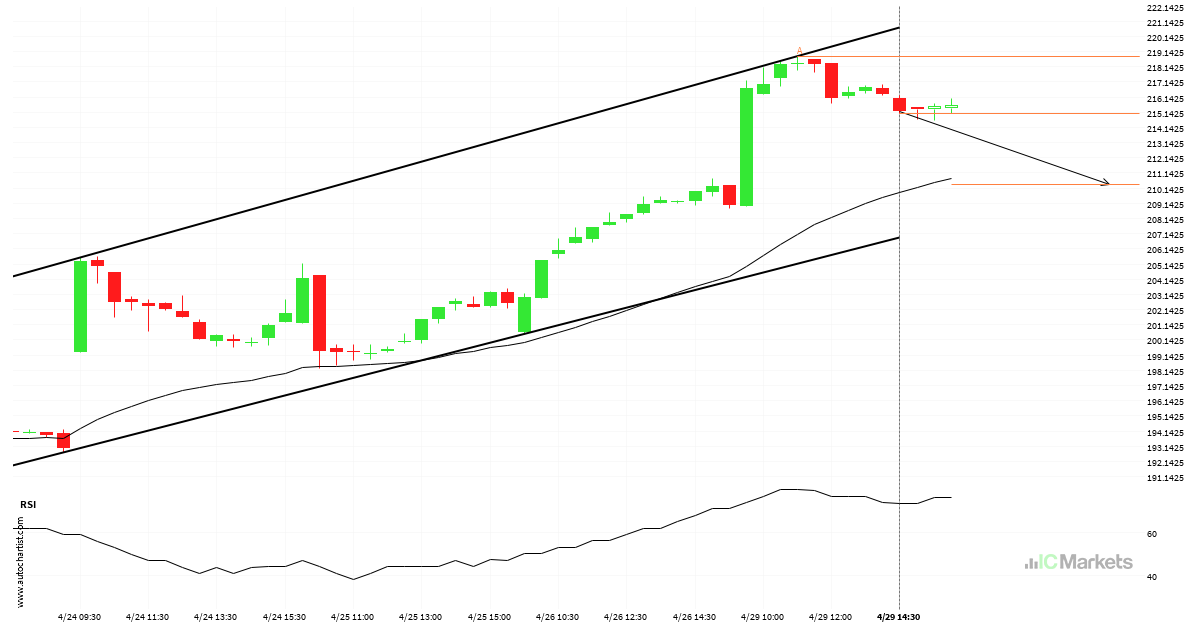
¿Deberíamos esperar una ruptura o una recuperación del Biogen Idec Inc?

Biogen Idec Inc está atrapado en una formación de Canal alcista, lo que implica que una rotura es inminente. Esta es una excelente configuración de trading tanto para los operadores de tendencia como para los de swing. Ahora se está acercando a una línea de resistencia que se testeó en el pasado. Los oportunistas de […]

Read more
April 29, 2024North_American_Stocks_esIC Markets

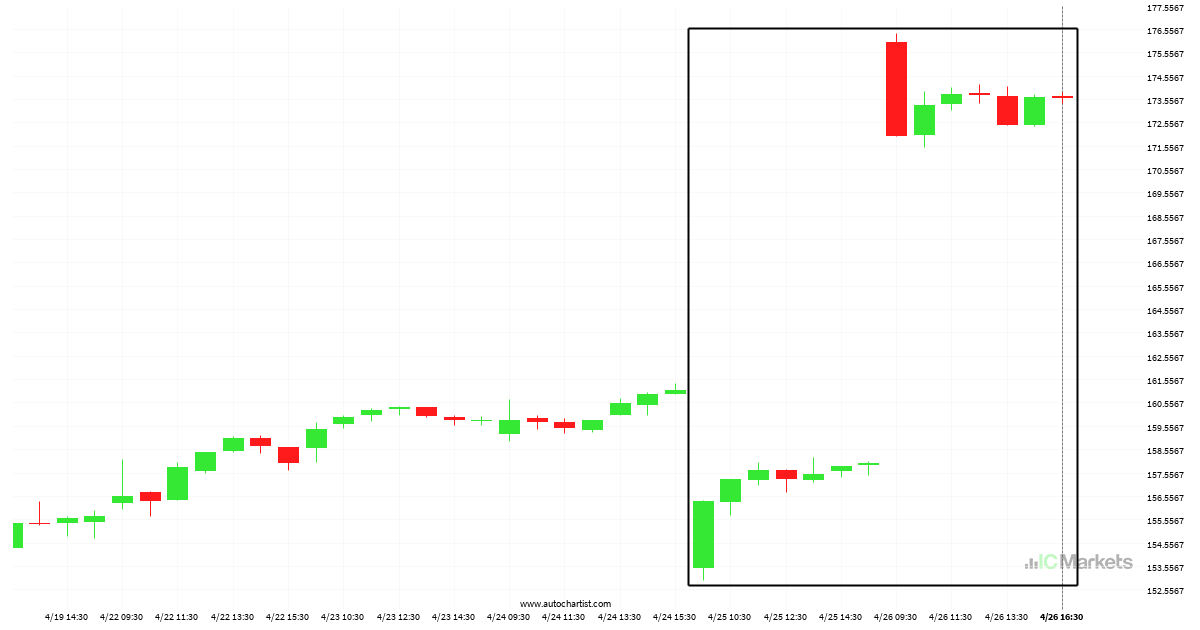
¿Rebotará ALPHABET INC CLASS C después de una gran subida?

ALPHABET INC CLASS C ha subido un 11,03% desde 156.36 hasta 173.61 en los últimos 2 días.

Read more
April 23, 2024North_American_Stocks_esIC Markets

¿Deberíamos esperar una irrupción o una recuperación del Biogen Idec Inc?

El Biogen Idec Inc avanza hacia 193.0100 y podría alcanzar este punto en un plazo de 5 horas. Ha probado esta línea previamente en numerosas ocasiones y esta vez no tiene porqué ser diferente, terminando con una recuperación en lugar de en una rotura. Si la rotura no ocurre, podríamos observar un retroceso de nuevo […]

Read more
  • 1
  • 2
  • 3
  • …
  • 13
  • 14
  • 15
  • 16
  • 17
  • 18
  • 19
  • …
  • 89
  • 90
  • 91

Recent Posts

  • UK 100 Index – المستوى الرئيسي – مقاومة
  • Gold vs US Dollar – نموذج الرسم البياني – قناة صاعدة
  • US Wall Street 30 Index – المستوى الرئيسي – مقاومة
  • Brent Oil vs US Dollar – نموذج الرسم البياني – قناة صاعدة
  • Brent Oil vs US Dollar – نموذج الرسم البياني – قناة صاعدة

Recent Comments

    Translation


     Edit Translation

    Trade with

    a market leader you can rely on

    Open Trading Account Try a Free Demo

    Forex Trading

    • Accounts Overview
    • Open an Account
    • Launch Web Trader

    Trading Specifications

    • Spreads and Commissions
    • Range of Market
    • Trading Hours
    • Funding
    • Withdrawal

    About IC Markets

    • Help Center
    • Why IC Markets
    • Regulation
    • Legal Documents
    • Contact Us


    Forex Trading

    • Accounts Overview
    • Open an Account
    • Launch Web Trader

    Trading Specifications

    • Spreads and Commissions
    • Range of Market
    • Trading Hours
    • Funding
    • Withdrawal

    About IC Markets

    • Chat with a Specialist 24/7
    • Why IC Markets
    • Regulation
    • Legal Documents
    • Contact Us

    Disclaimer: This material is marketing material where all marketing material is published for informational purposes only. This material does not contain and should not be considered as containing - investment advice and recommendations, or suggestions for performing any actions with financial instruments. The built-in widgets belong to their external independent authors, and IC Markets is not responsible for their content and their impact on trade.

    All content rights reserved. Opinions of the authors may not coincide with the opinion of the blog editors. When copying materials from this site or connecting to an RSS feed to republish our articles, a link to IC Markets or attribution in the format ‘IC Markets Blog’ is required. For general questions, please contact the editorial office via the form on the Contact us page.

    Risk Warning: Trading Derivatives carries a high level of risk to your capital and you should only trade with money you can afford to lose. Trading Derivatives may not be suitable for all investors, so please ensure that you fully understand the risks involved and seek independent advice if necessary. A Product Disclosure Statement (PDS) should be considered before entering into a transaction with us.

    The contents of this page are general information only and does not take into account your personal situation, financial objectives or needs. It is up to you to make sure the products that we offer suit your specific needs. You should not trade with us unless you understand the features and risks of the products that we offer. This means that you might need to seek independent advice before you start trading with us.

    © 2022 Raw Trading Ltd | All rights reserved.
    • Sample Page